COVID Atlas Documentation 🖥️ 😷 http://covidatlas.co/
||Data Sources: NASA GIBS API, COVID19 API, World Bank APIs ||
Submission to NASA Spaces Apps COVID19 Challenge
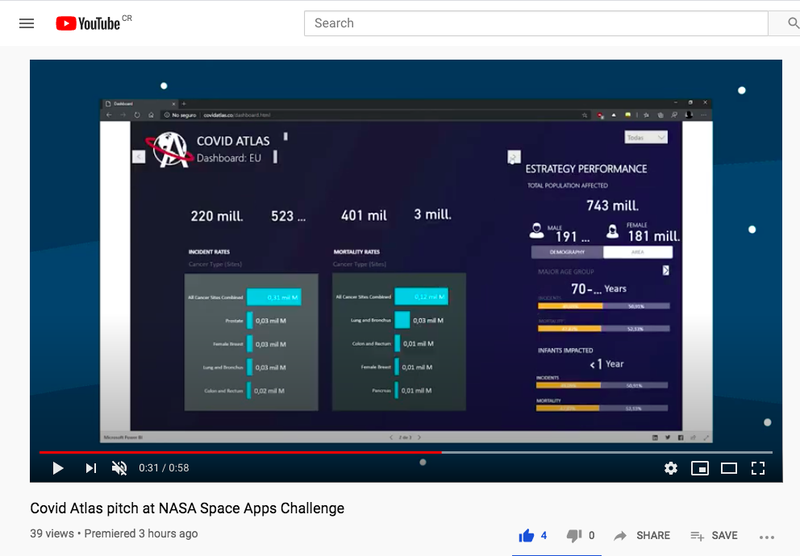
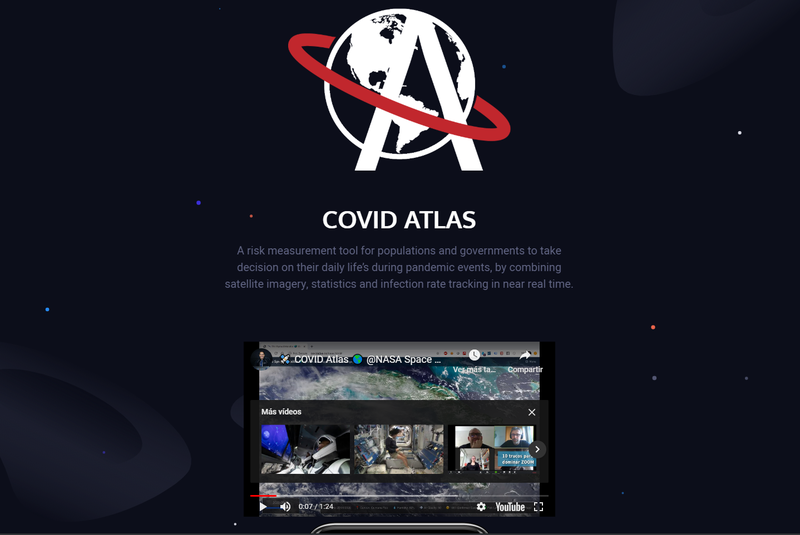
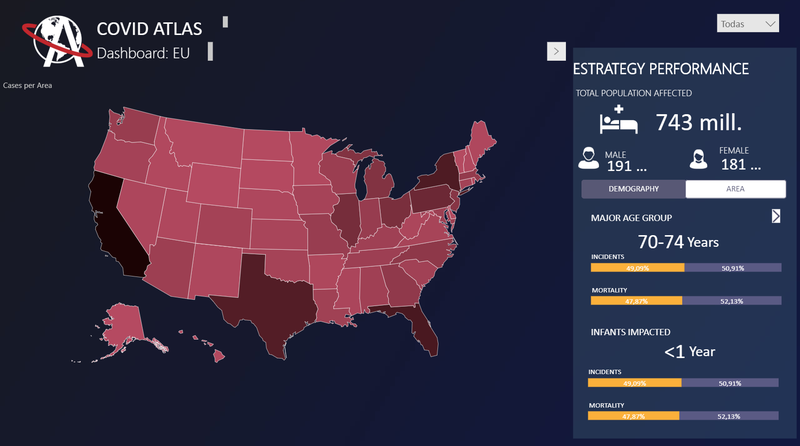
COVID Atlas is a risk measurement platform for Citizens and Governments to have a better understanding and decision making on their daily life’s during pandemic events, by combining satellite imagery, economic data and health statistics in near real time.
Phase 1: Earth Exploration
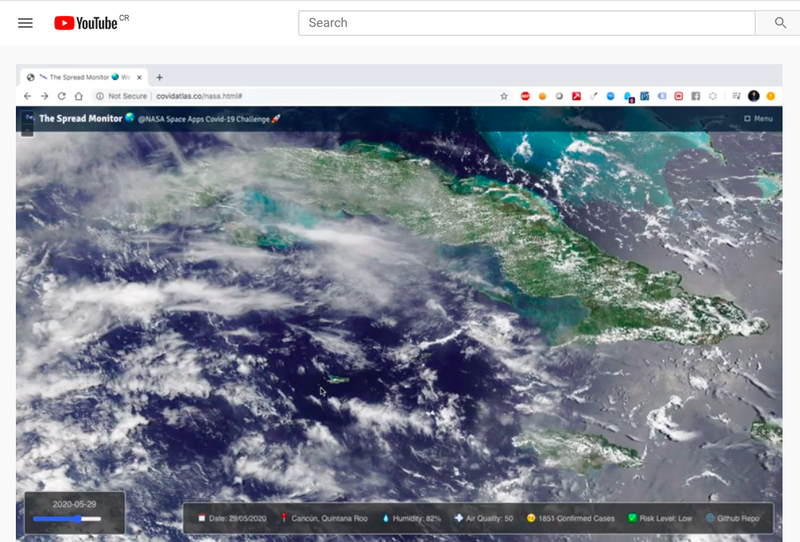
We use the NASA's Global Imagery Browse Services (GIBS) APIs as a Data Provider for the satellite imagery and visualize the Data Layers using Web Map Title Service (WMTS) such as:
- URL: https://gibs.earthdata.nasa.gov/wmts/
- Layer: (e.g. "MODIS / Terra")
- Matrix Set:'EPSG_(n)m'
- Origin:[Lat, Long]
- Resolution:[0...2]
- Tile: Open Layers
Create Layer function:
function createLayer() { var source = new ol.source.WMTS({ url: 'https://gibs.earthdata.nasa.gov/wmts/epsg4326/best/wmts.cgi?SERVICE=' layer: 'MODIS_Terra_Property1_Property(n)', format: 'image/jpeg', matrixSet: 'EPSG_(N)m', tileGrid: new ol.tilegrid.WMTS({ origin: [Lat, Long], resolutions: [ 0...(n) ], matrixIds: [0, 1, 2, 3, 4, 5, 6, 7, 8], tileSize: 512 }) });Phase 2: Get COVID19 cases
We use the COVID19 API from Data Providers such as World Health Organization to get the epidemiologic data of Total Test results values by Country/Region & Date such as:
Positive cases: ${covid19['positive']}
Negative cases: ${covid19['negative']}
Hospitalized: ${covid19['hospitalized']}
Death: ${covid19['death']}`
Recovered: ${covid19['recovered']}`
URL: curl --location --request GET 'https://www.who.int/rss-feeds/news-english.xml'
const getCovidStats = async() => { try { const response = await fetch('https://www.who.int/rss-feeds/news-english.xml'); const usa = await response.json(); covid19 = country[0]; } finally { markup = ` Tests: ${covid19['totalTestResults']} Positive: ${covid19['positive']} Negative: ${covid19['negative']} Hospitalized: ${covid19['hospitalized']} Deaths: ${covid19['death']}` document.getElementById('main').innerText = markup; } }; getCovidStats(); </script>Phase 3: World Bank Data APIs
Aggregate economic data indicators to the model such as GDP, Income Level, Total Population and Poverty Severity, to have a better understanding of the economic impact per Country:
Complete list of All World Bank Indicators
http://api.worldbank.org/en/countries/country/indicators/- Income Level
http://api.worldbank.org/V2/incomeLevel/LIC/country- Total Population
http://api.worldbank.org/v2/country/cr/indicator/SP.POP.TOTL?date=2010:2020- Poverty Severity
http://api.worldbank.org/en/countries/CR/indicators/1.0.PSev.Poor4uds?date=1961:2011&per_page=2000World Bank API supports the following four output formats: XML, JSON, JSONP, JSON-stat
Phase 5: Machine Learning Model
The combined data inputs from P1, P2, P3 & P4 train our model in the multiple available variables.
Phase 5: Social Media APIBy Meassuring near real time Keyword trends in search engines we can Correlate the socio economic variables such as: (i) Total Population, (ii)GDP, Country Debt, (iv) Foreign Investment, (v) Public Transport Statistics and (n) other predictors as (vi) Education for adjusting our COVID19 Spread risk and prevention model scoring.
KeywordTrends.dailyTrends({ trendDate: new Date('2019-01-10'), geo: 'US',}, function(err, results) { if (err) { console.log(err); }else{ console.log(results); }});Step 6: Aggregate Computational Epidemiology modelingUsing online social data to track pandemics and model aggregate data to the COVID19 Risk Level Scoring to understand the Pandemic, it's propagation and correlate better with it's Economical impact in the Population.

