--ESET--| Quiet Planet
Team Updates
6. Project submission
We finished all the presentation of the differents parts of the project and we just submitted it! You can check all the process and the project itself in the Project Tab.
5. Complete the presentation of the project
We finished the project, today we will concentrate in finishing the presentation of the project, we already have the 30 seconds video and the 3 slides that explain our application that we called BikeAir. We will upload to Gihub the whole project during the day.
Finishing the prototype
We just finished the prototype with AdobeXD, so tomorrow will be dedicated to design the presentation.
4. Build a prototype of the application
After lunch, the objective is build a prototype of an application to put in practice the solution that we imagined this morgning: encourage Paris citizens to use bikes instead of cars when going to work, to school, etc. We see that this solution could be very interesting for the major of Paris that is investing considerable resources to continue to use bikes as a means of transportation after the COVID-19 lock-down as this artcile that appeared last week in Le Monde shows.
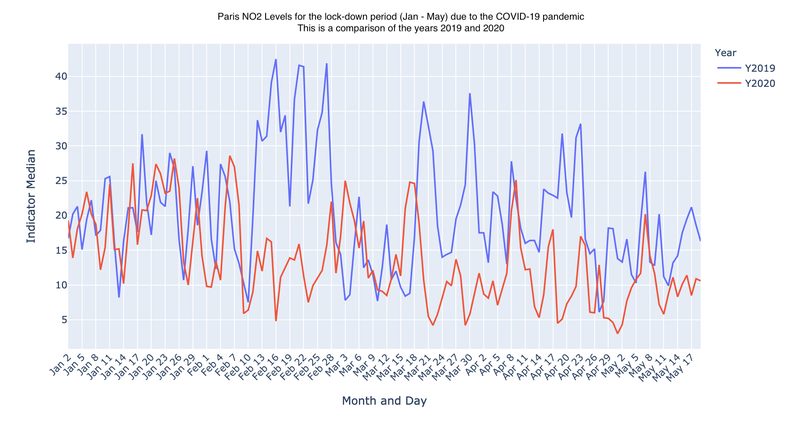
From the precedent analysis, we concluded that we need to retrieve from an API the level of NO2 (Nitrogen Dioxide) daily for the city of Paris to use in an application that will encourage citizens of Paris to use a bike as a means for transportation. We will design this solution this afternoon and tomorrow morning.
Results of the data analysis
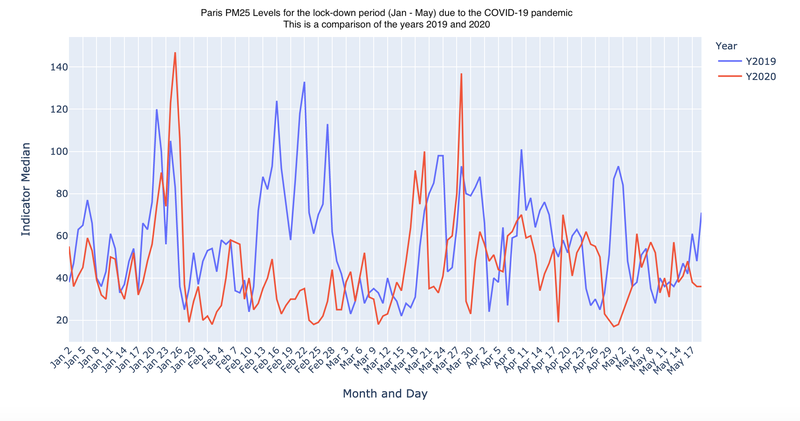
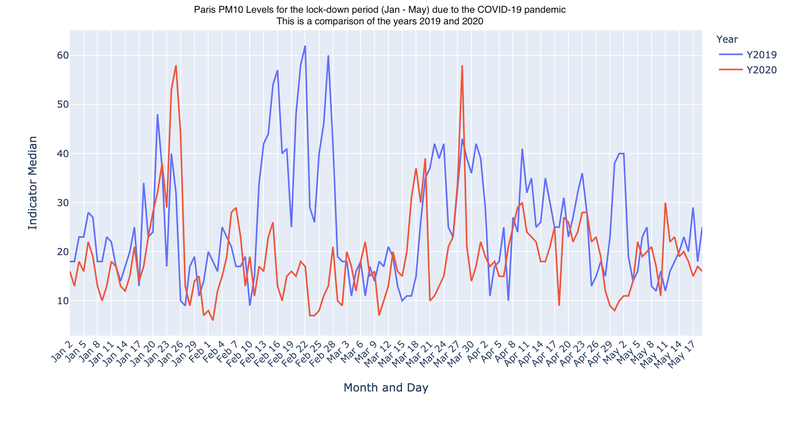
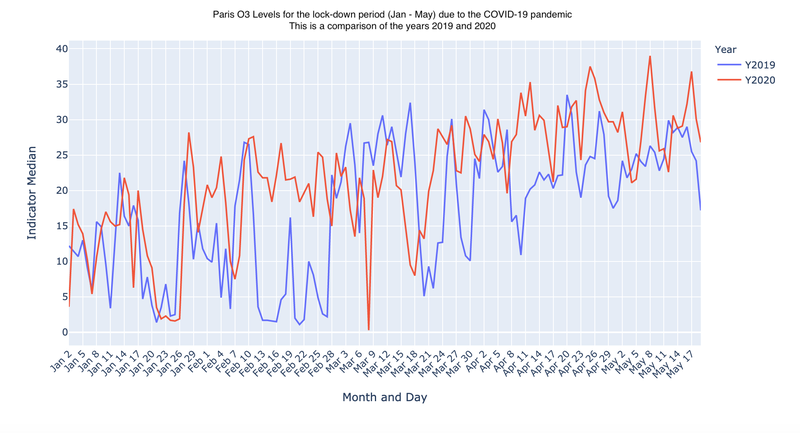
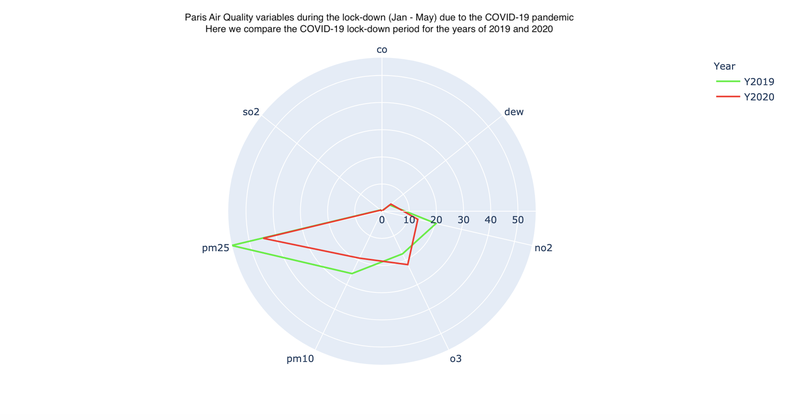
- First, we extracted the variables related with air quality (carbon monoxide, aerosol optical depth, nitrogen dioxide, ozone, PM25 and PM10) for the city of Paris concerning the periods of January to May. Our objective was to compare the years of 2019 and 2020, so we extracted the data corresponding to January to May 2019 and 2020 to see if we could find any differences and in which variables.
- Next, we created a radar plot to compare the different variables for both years concerning the city of Paris (you can find the Radar Plot in the images section). We found a difference in four of the variables: a difference in no2 (Nitrogen Dioxide) that primarily gets in the air from the burning of fuel (cars, buses, etc.), we also found a difference in the levels of pm25 and pm10, this is probably related to the difference in no2 and other factors. We saw a small difference in o3 (Ozone), but in fact we see a higher level of o3 in 2020. We can not remark other differences concerning air quality for the COVID-19 lock-down period of 2019 and 2020.
- Then, we created a Line Plot for the 4 variables of interest to zoom in each day and better understand what happened during the COVID-19 lock-down. You can find the plots in the images section. We clearly see the impact of the Paris lock-down in 3 of the variables mentioned above: no2, pm25 and pm10.
- If we take the mean of these 3 variables, we can obtain a number representing the quality of the air and use it to build our application to encourage the citizens of Paris to to continue to improve the quality of the air of the city after the lock-down.
You can find the notebook of our analysis in the code section.
3. Search information about the data to use in the solution
Before to start to build the solution, the next step is to use Python (Pandas) to analyze the impact of COVID-19 on the Paris Air Quality.
We will use a Jupyter Notebook to illustrate this analysis, we will put the notebook on the code section.
For the application, we can calculate an Index from 4 variables that we obtained from the "Find Environmental Impacts Data" page:
The first idea that comes to mind is to normalize the daily values of these variables and multiply them to obtain an Index of "Air Quality" that we can integrate to the application as a reference for the user.
The solution
After the brainstorming, one interesting solution came to mind:
The city of Paris is investing a lot of money to encourage citizens to use bikes instead of cars. The solution imagined is to build an application that uses the data to measure the air quality to encourage the citizens of Paris to use a bike in replacement of a car (to go to work, to go to study, etc.).
2. Search for the solution session
The next hour is dedicated to the search of the solution to answer the above problem statement.
Problem statement
3 interesting problems came into mind:
1. Industrial activities were impacted by the COVID-19 pandemic, how can we encourage industries to rethink their production system?
2. A lot of people (at least in France) started to go to install outside the big cities, how these movements of people impacted cities and little towns? How can we develop an equilibrium between people living in crowded cities and small towns?
3. The quality of the air was impacted by the COVID-19 pandemic, how to continue to impact positively the quality of the air?
The decision was to go for the third problem: How might we motivate citizens to continue to improve air quality in big cities? To narrow the problem, we will concentrate in the city of Paris having the following problem statement:
How might we motivate the citizens of Paris to continue to improve the quality of the air of the city after the COVID-19 pandemic?
1. Brainstorming Session
The next hour is dedicated to Brainstorm problems for the for the First Challenge: Quit Planet.