This is an attempt to understand what is happening in the world by taking up the findings of the latest paper on CO2 emission reduction by COVID-19.
Incorporate the latest scientific knowledge using earth observation satellite data as a new function into the GPS logging enabled map application.
Background
As a challenge for this time, I have recently been personally interested in global warming issues and earth observation data, and I am going to do various research in the future, so I chose "Quiet Planet".
My project title is "Thinking of Temporary reduction in global CO2 emissions", I will explain its background. The global expansion of the COVID-19 pandemic and its impacts have transformed the world's unprecedented economic and social conditions, we are facing and living in that situation now.
It's difficult to get a bird's eye view of what's happening right now, but over the past few months I experienced, my challenge has begun with an awareness of what the global CO2 emissions are like.
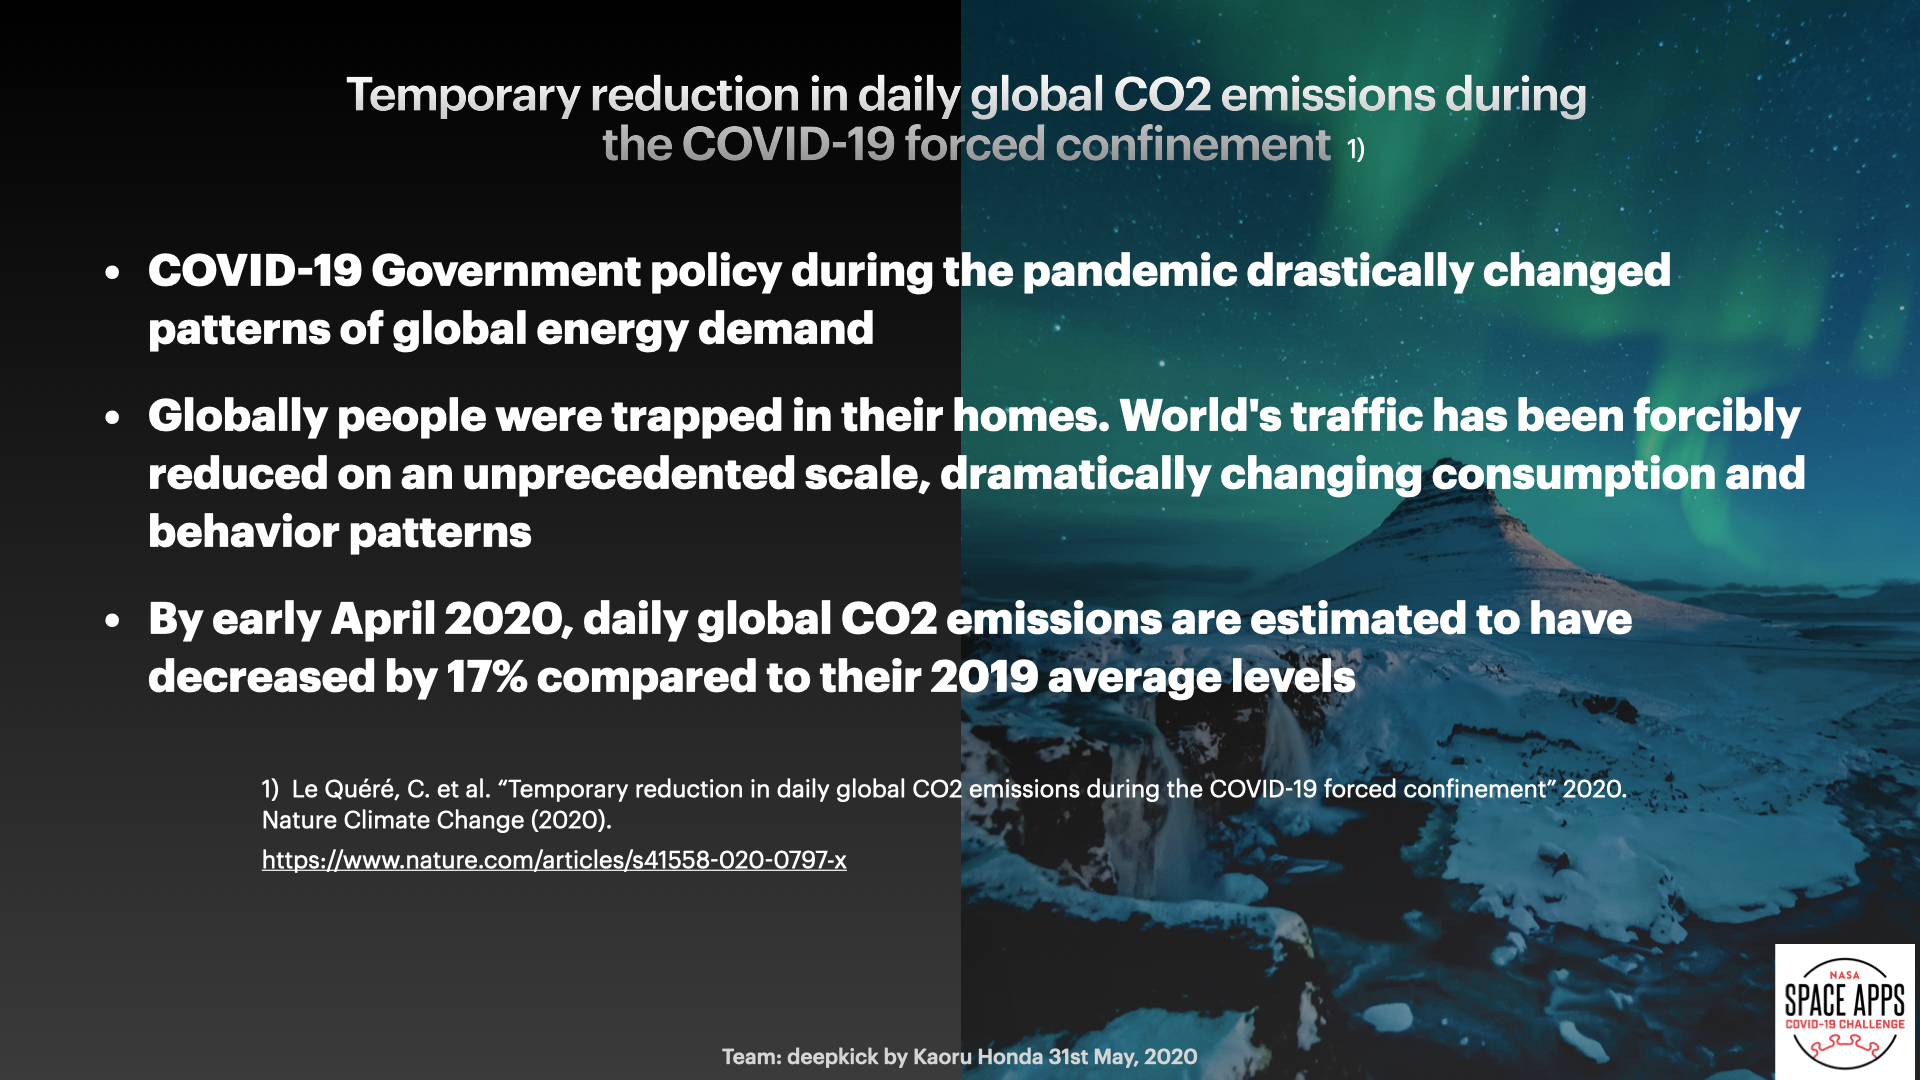
Temporary reduction in daily global CO2 emissions during the COVID-19 forced confinement
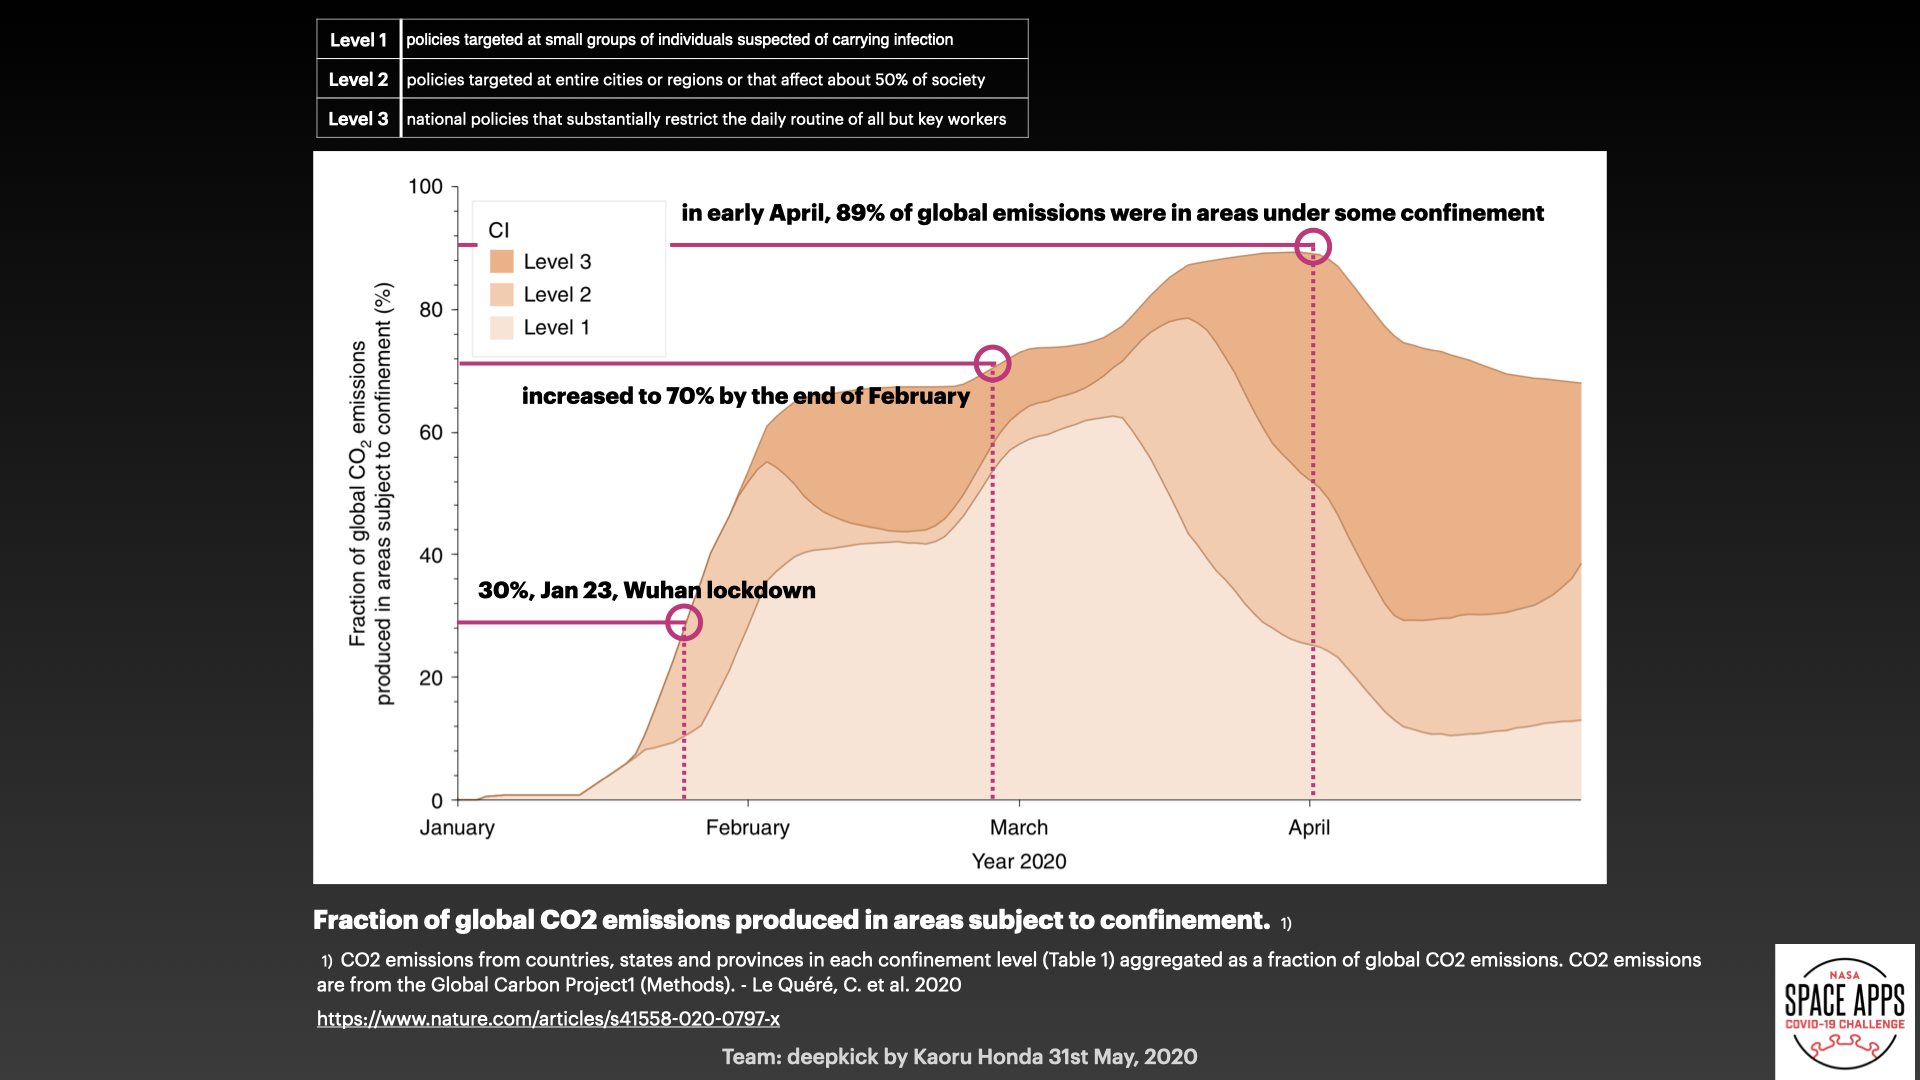
Fraction of global CO2 emissions produced in areas subject to confinement
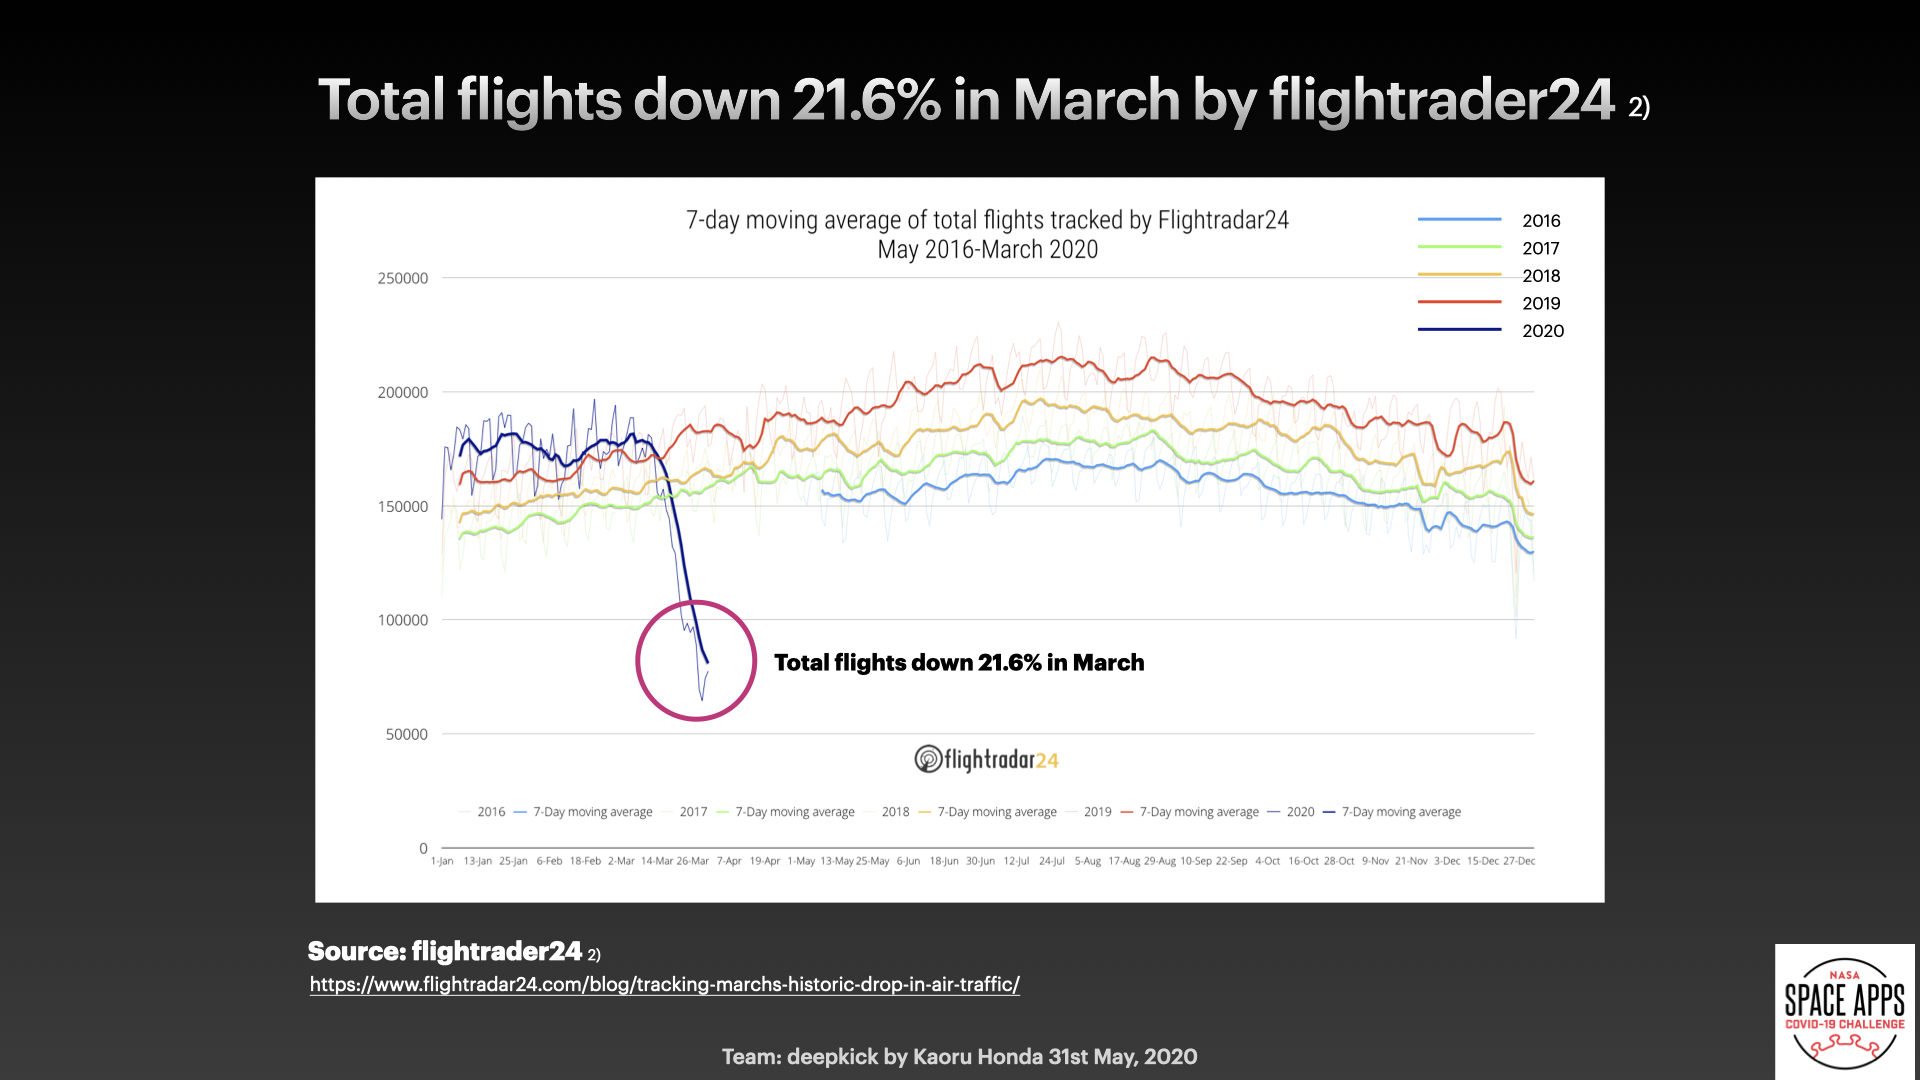
Total flights down 21.6% in March by flightrader24
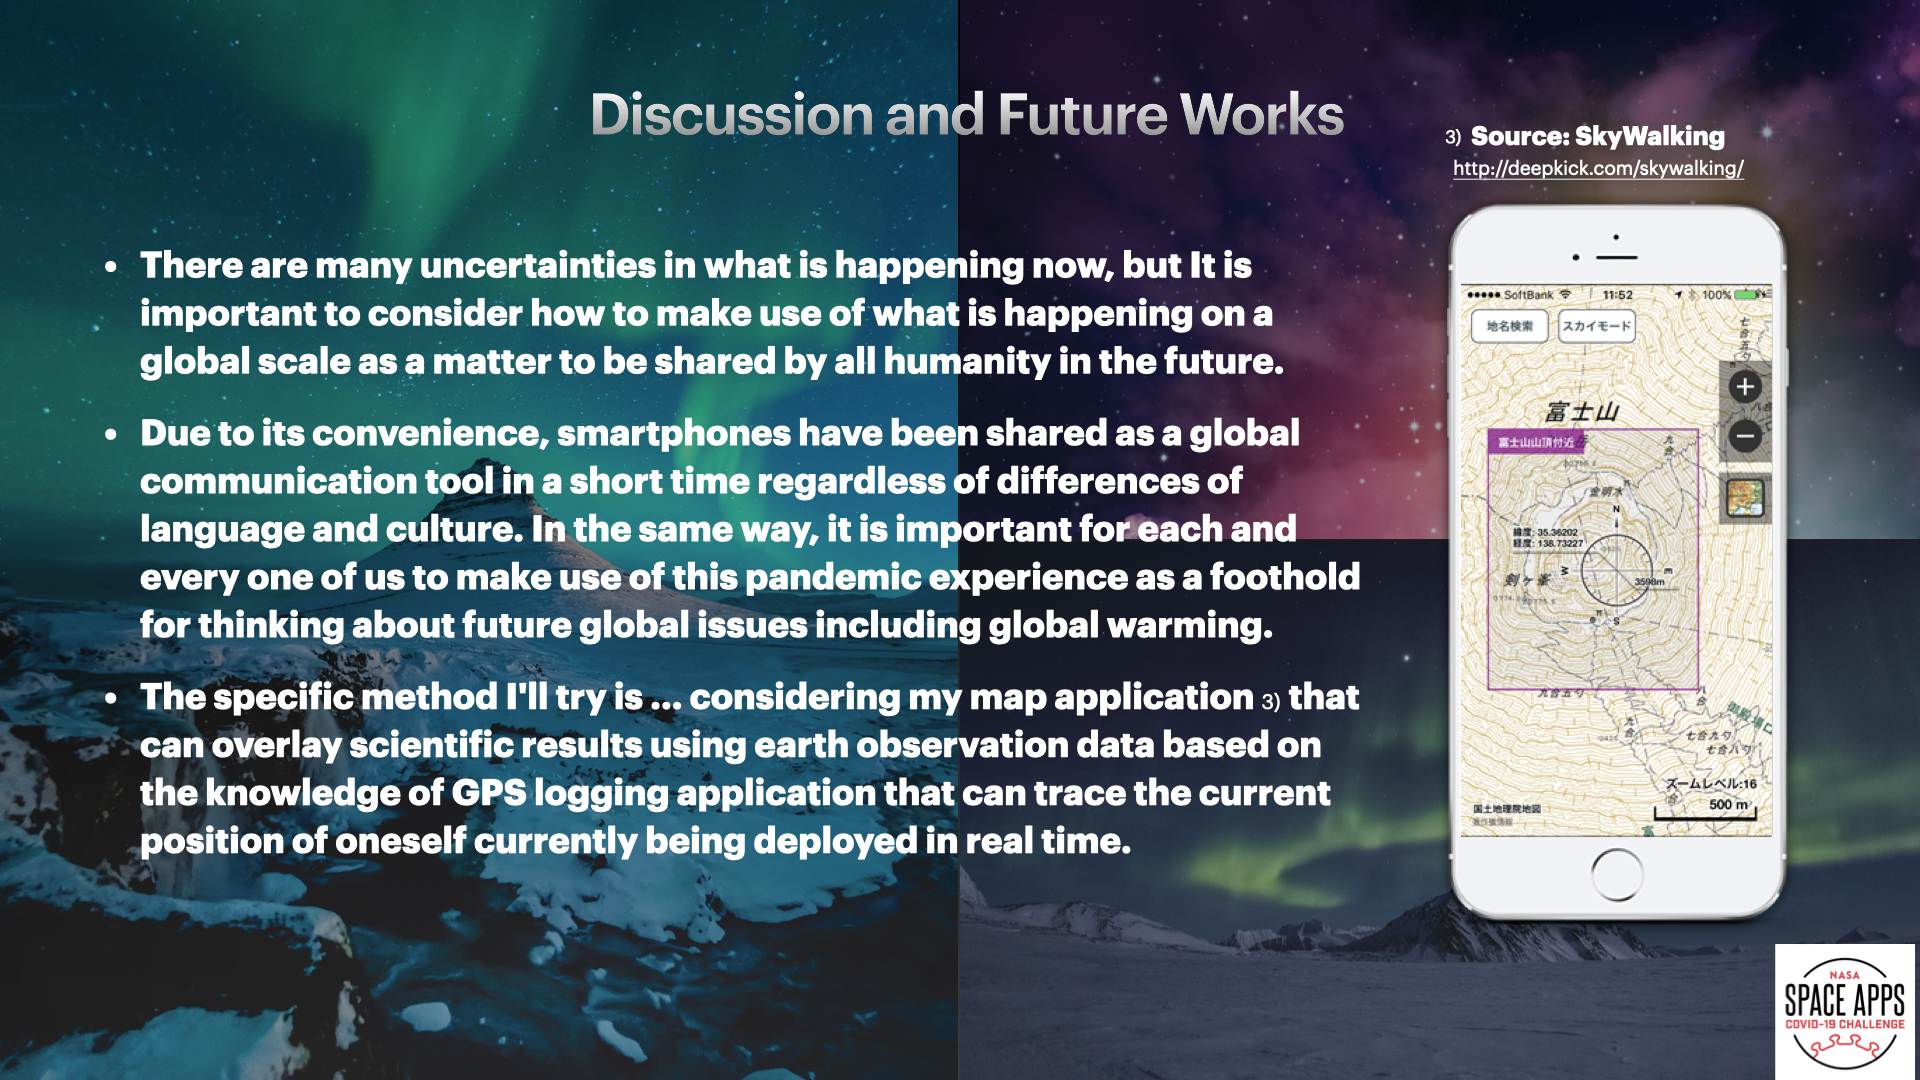
Discussion and Future Works
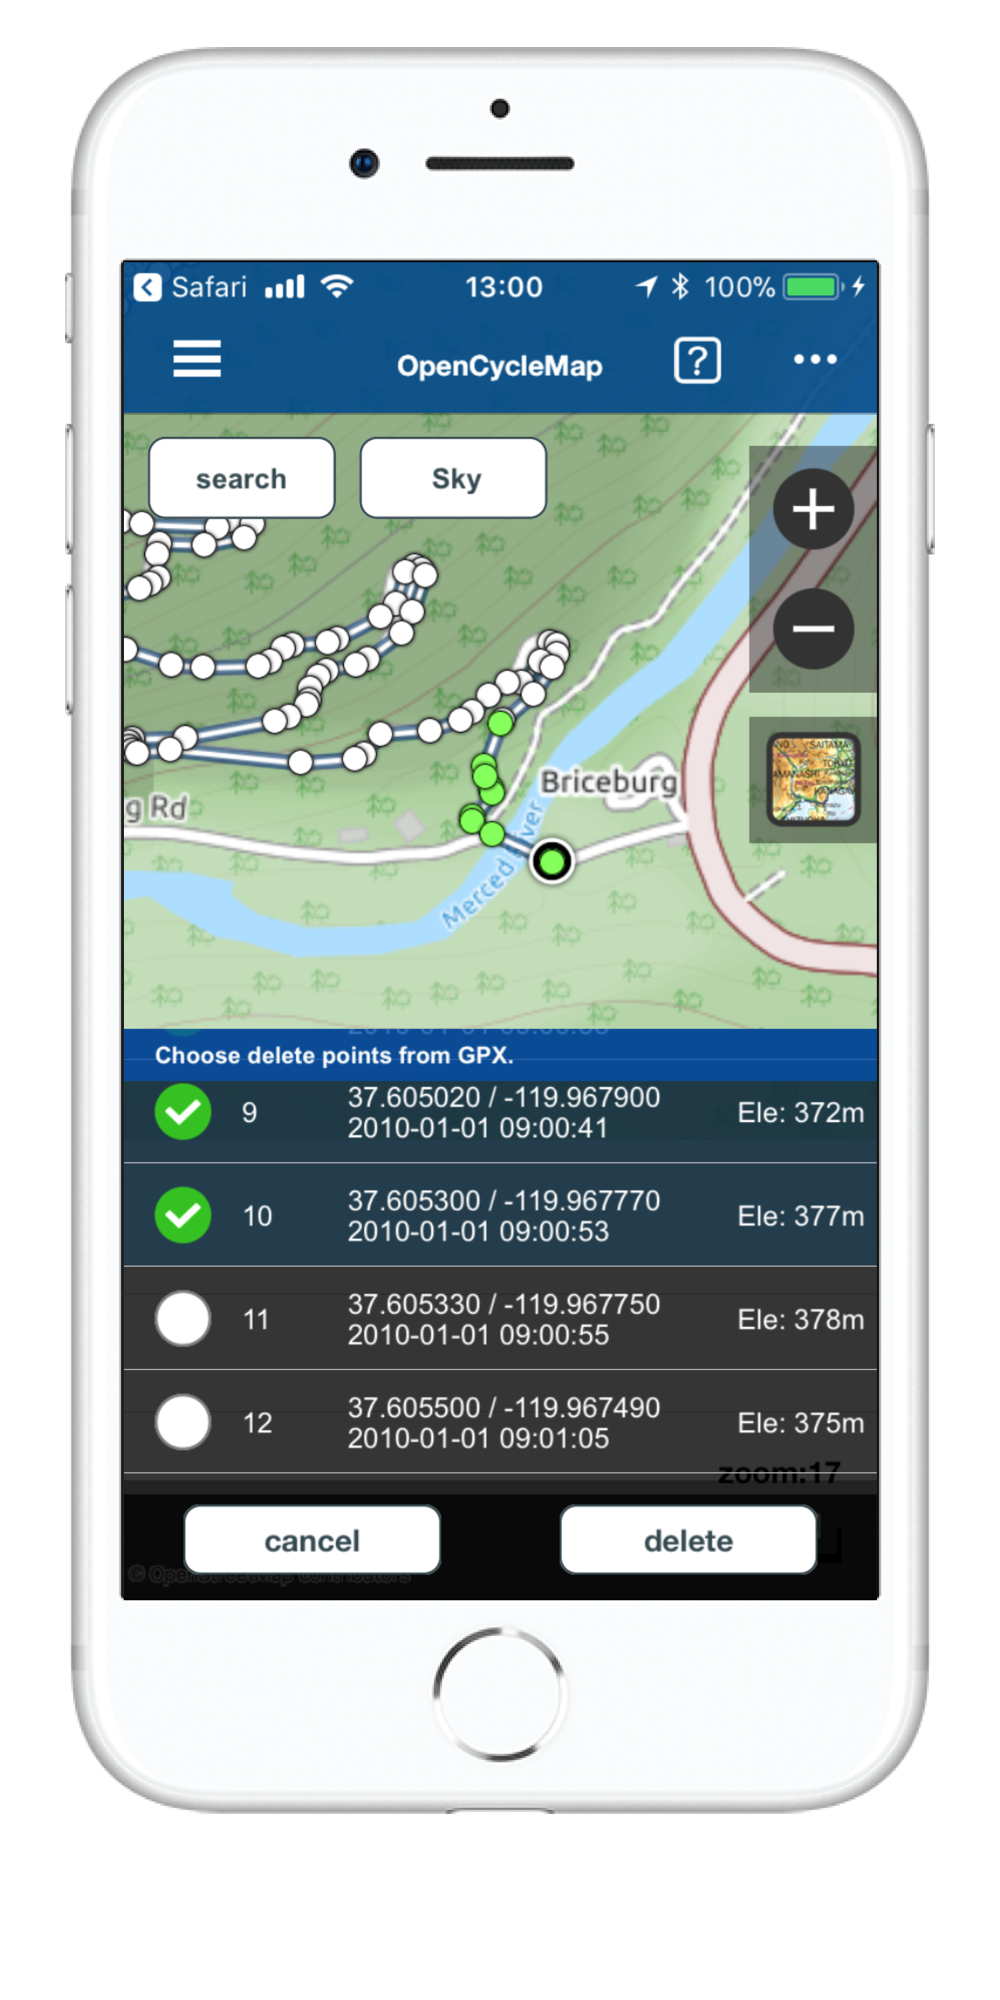
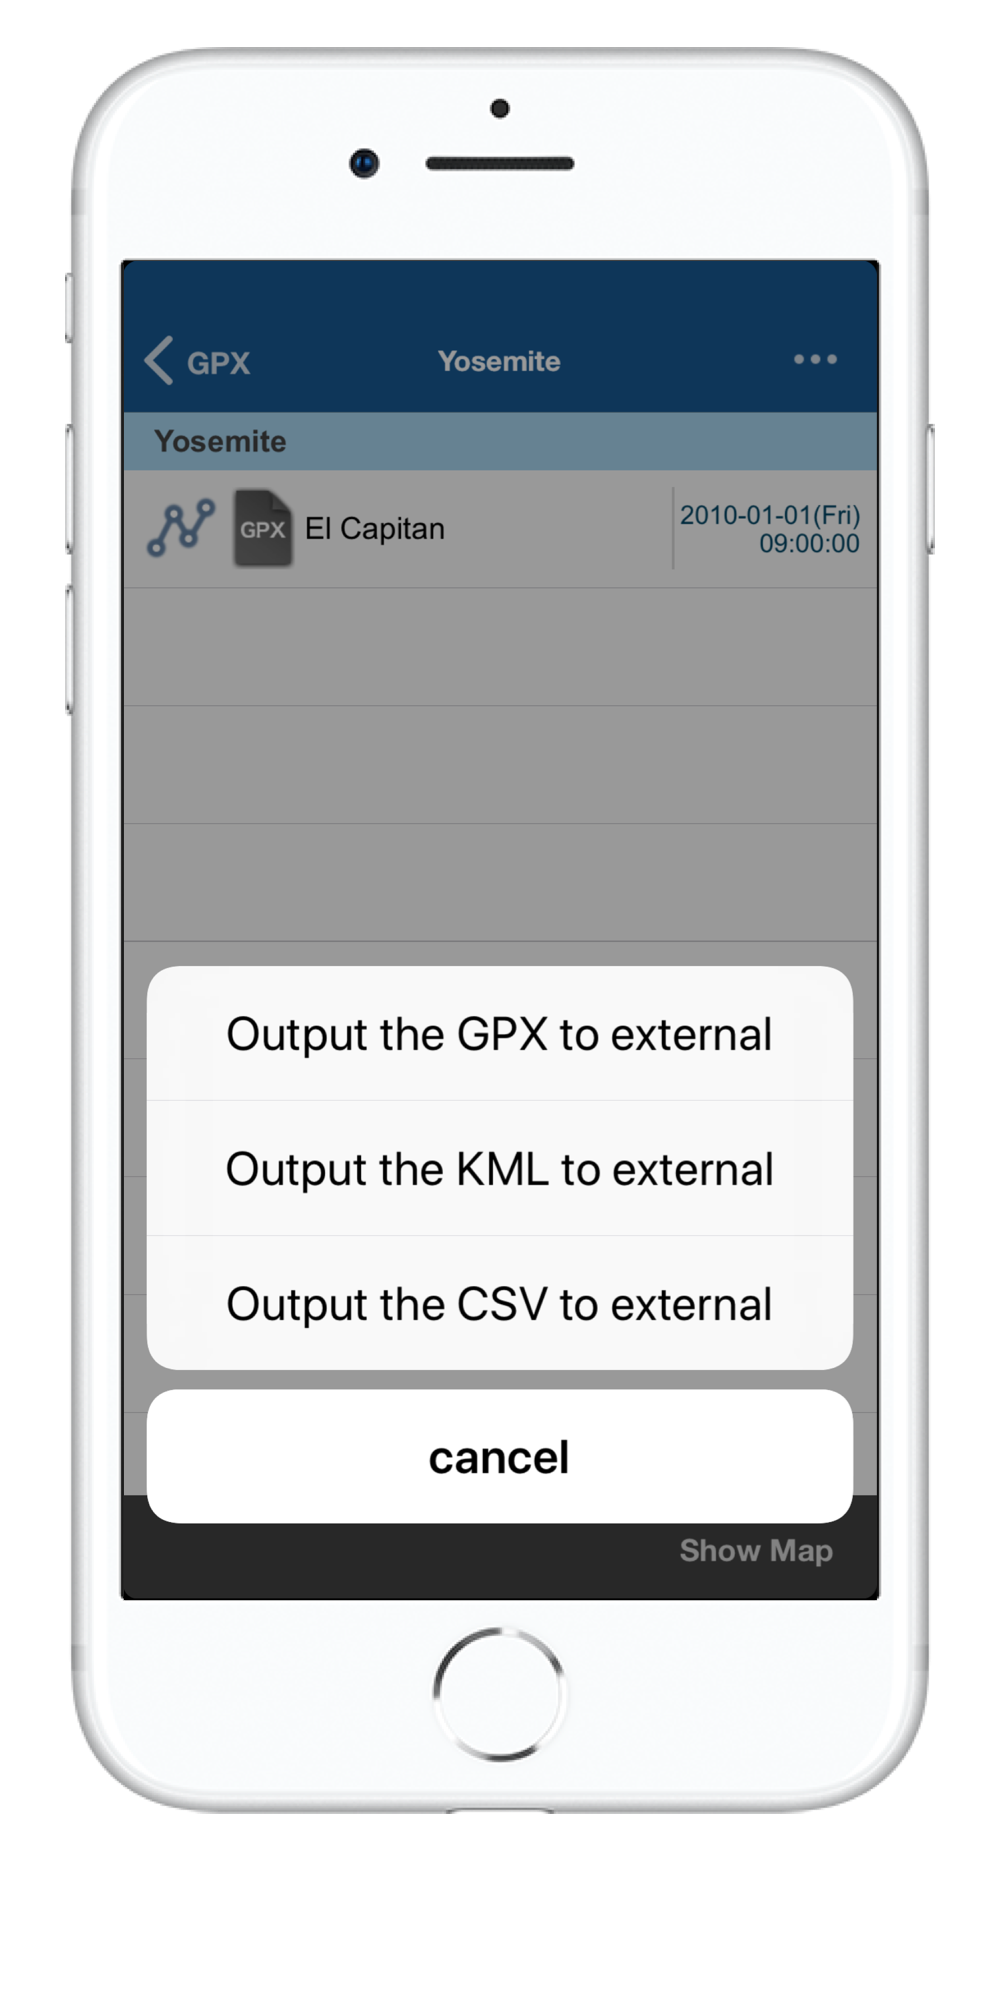
I will show effective methods to take a bird's eye view of what is happening in the world using satellite data and geospatial information by developing my map app.
Video
* SkyWalking - Demonstration MOVIE
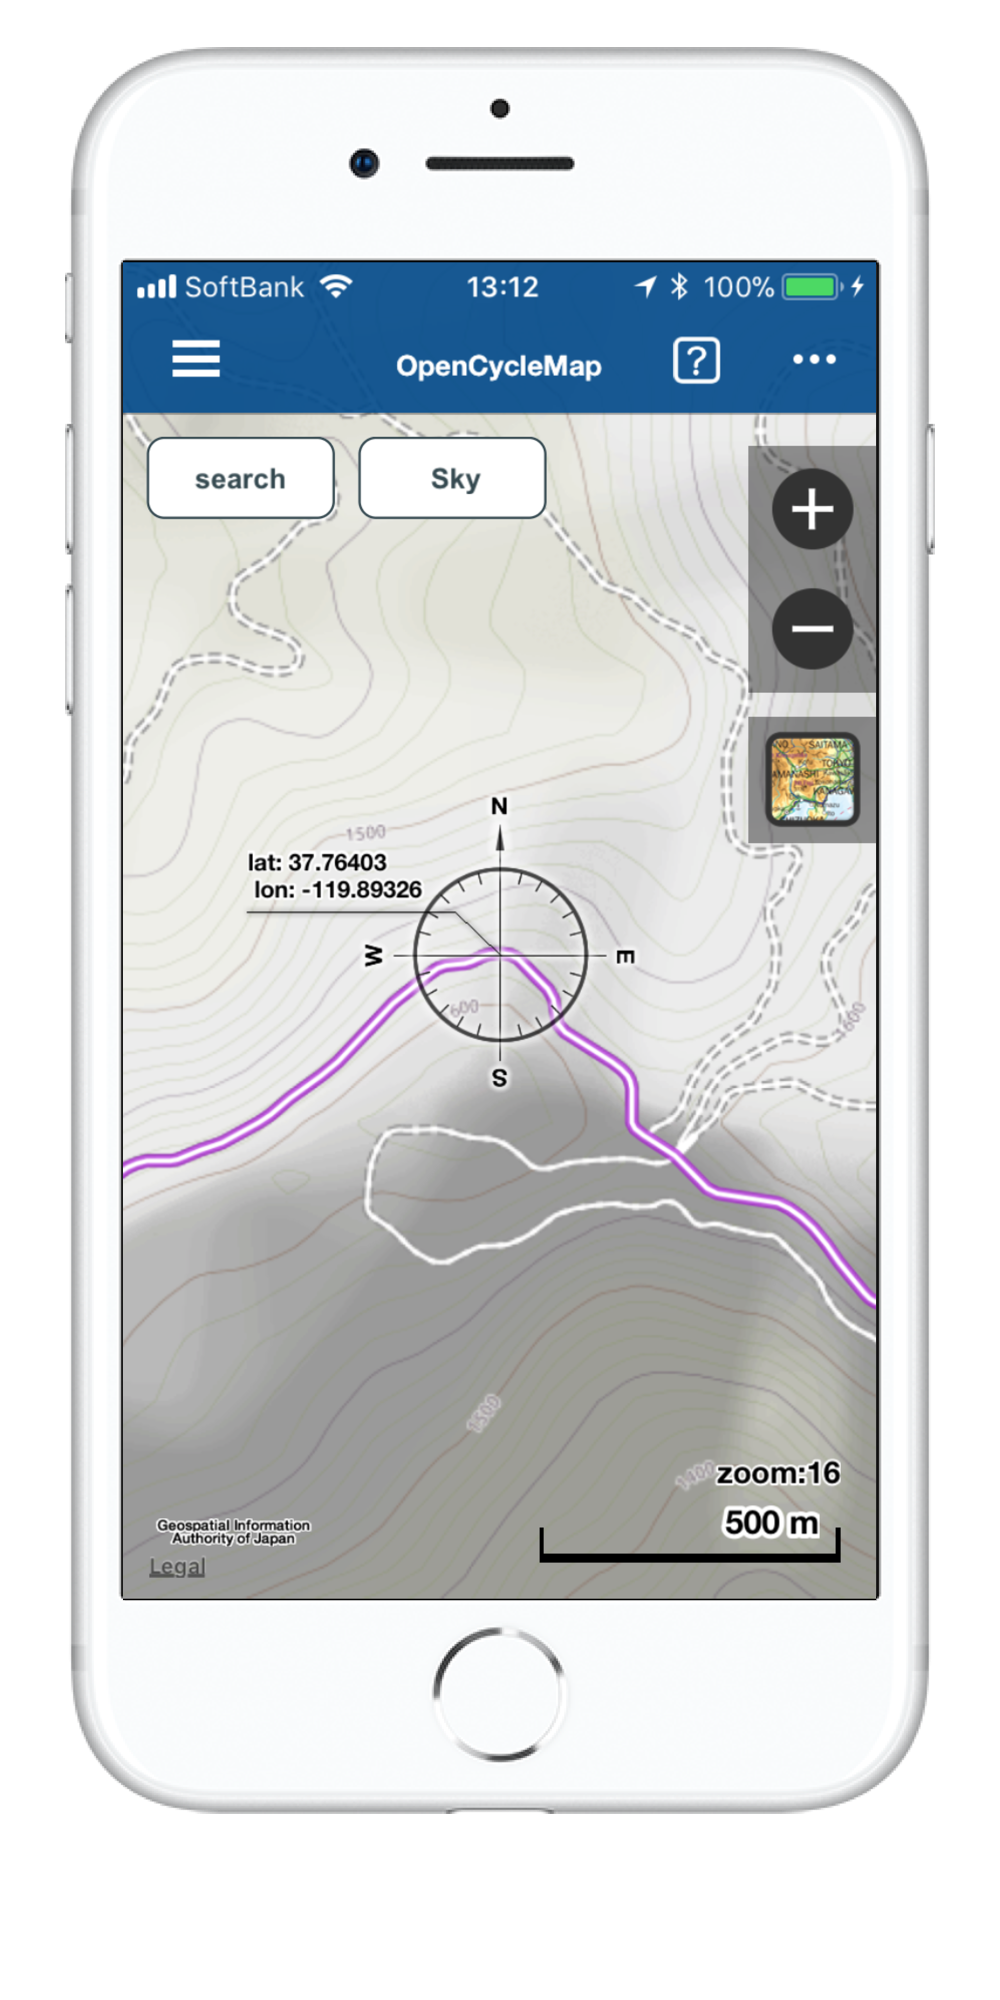
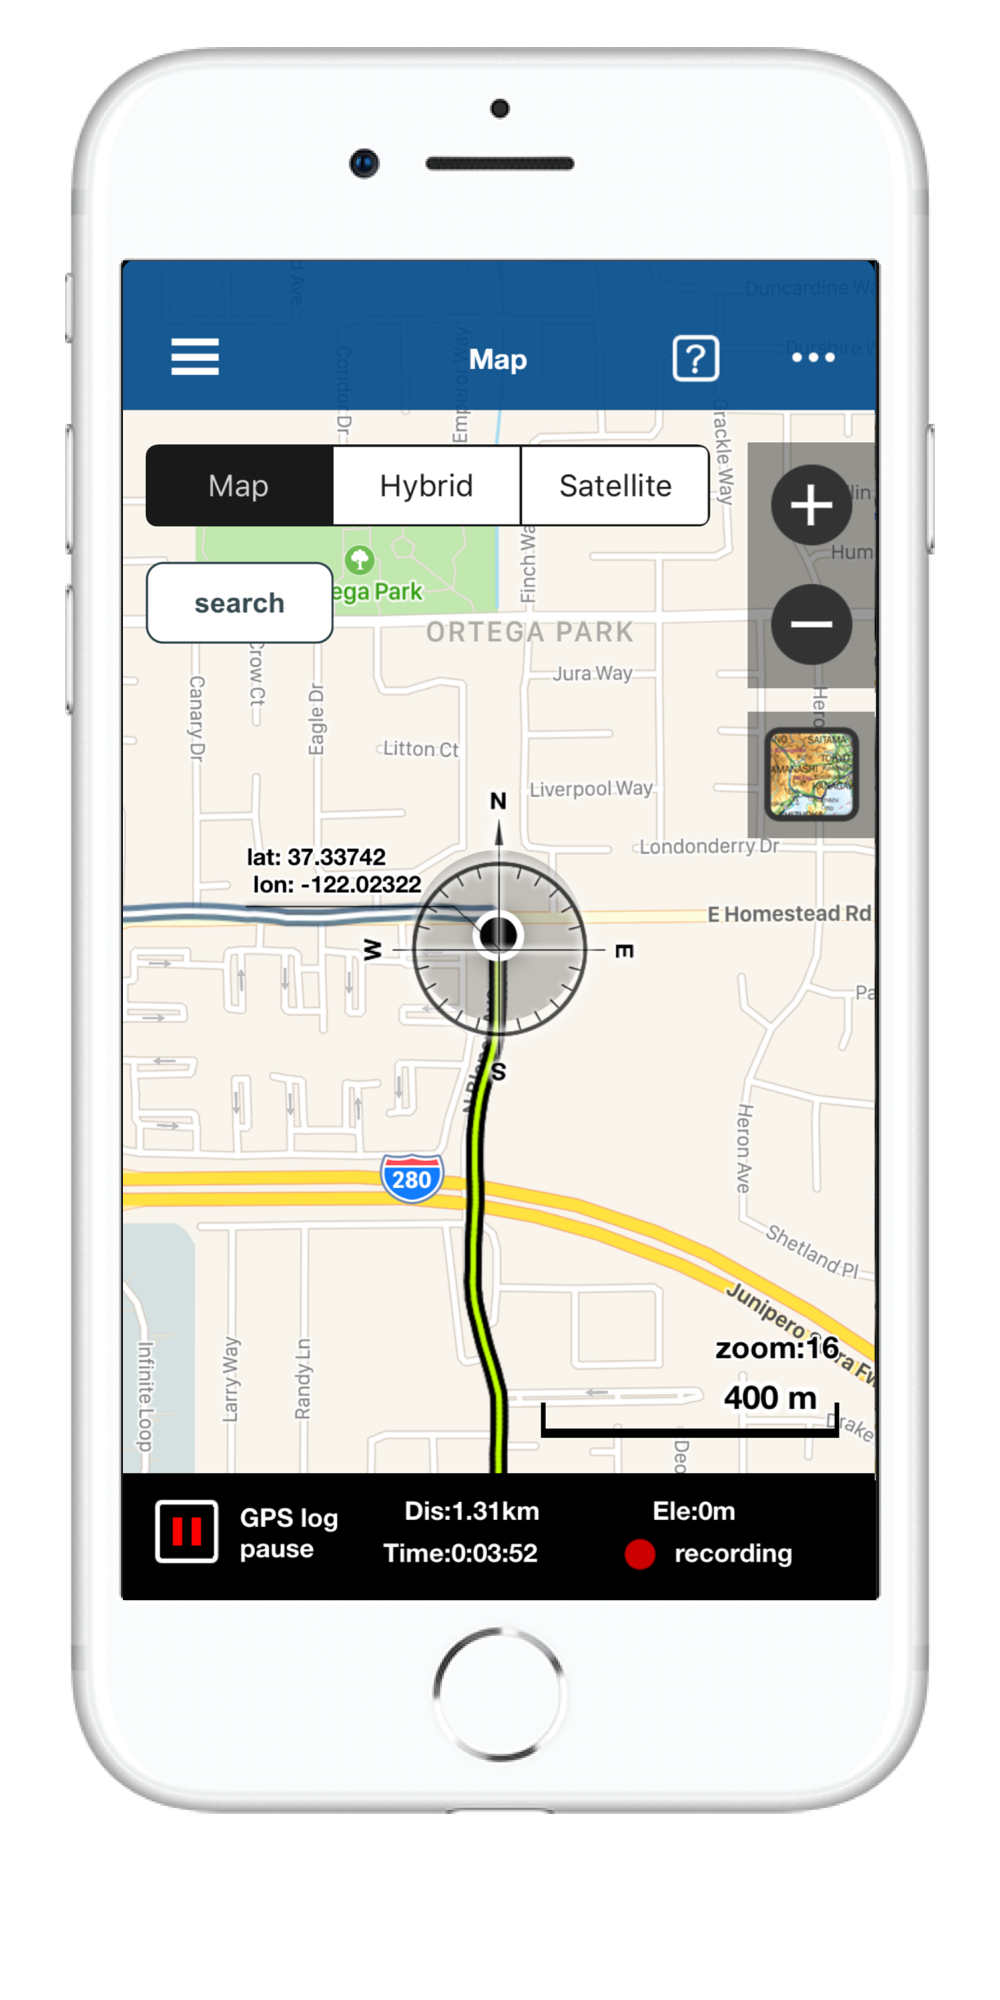
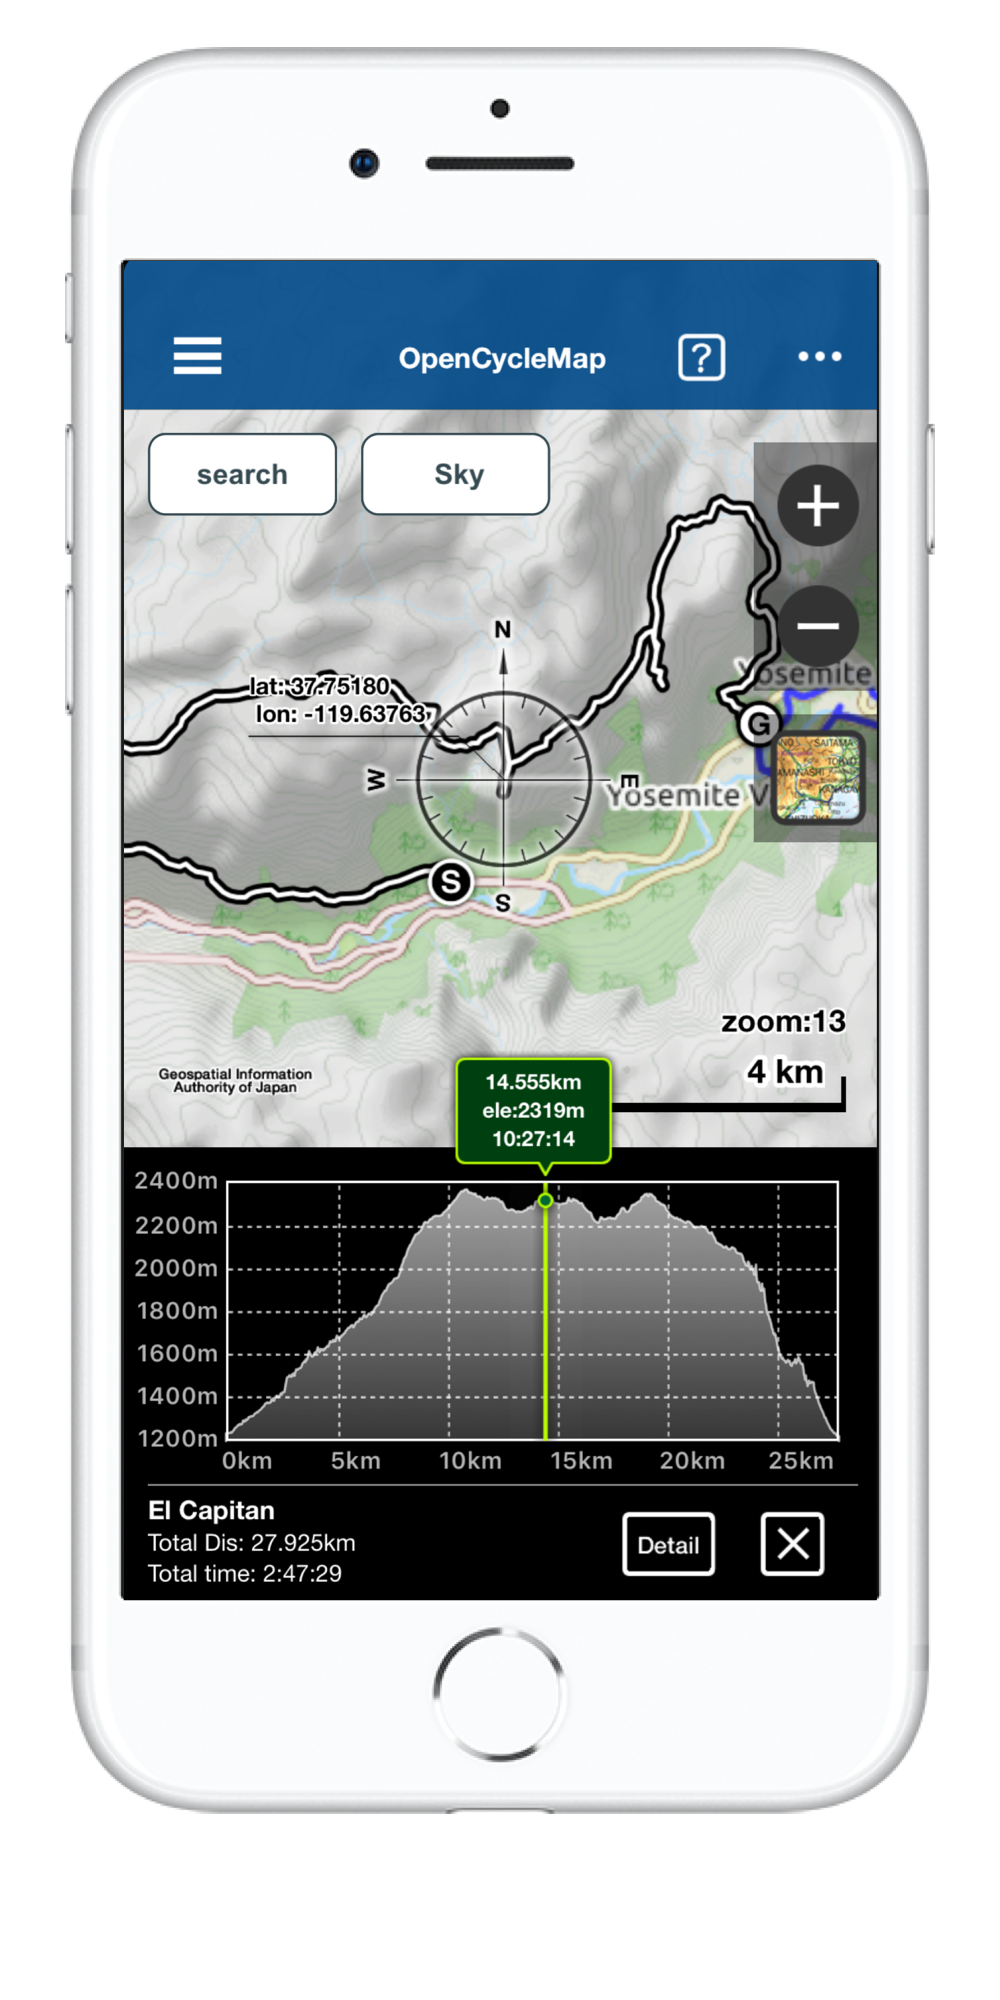
ScreenShots
1) Le Quéré, C. et al. “Temporary reduction in daily global CO2 emissions during the COVID-19 forced confinement” 2020. Nature Climate Change (2020). https://www.nature.com/articles/s41558-020-0797-x
2) Oxford COVID-19 Government Response Tracker, BBC Research https://www.bbc.com/news/world-52103747
3) flightrader24
https://www.flightradar24.com/blog/tracking-marchs-historic-drop-in-air-traffic/
4) SkyWalking
http://deepkick.com/skywalking/
5) Global Nitrogen Dioxide Monitoring Home Page
https://so2.gsfc.nasa.gov/no2/no2_index.html
6) Geospatial Information Authority of Japan - Chiriin Tiles