Big Dipper| SDGs and COVID-19
Team Updates
https://graphql.org/
A query language for your API
GraphQL is a query language for APIs and a runtime for fulfilling those queries with your existing data. GraphQL provides a complete and understandable description of the data in your API, gives clients the power to ask for exactly what they need and nothing more, makes it easier to evolve APIs over time, and enables powerful developer tools.
https://basecamp.com/how-it-works
A software very useful and free for work together!
https://dart.dev/
You can use Dart to write simple scripts or full-featured apps. Whether you’re creating a mobile app, web app, command-line script, or server-side app, there’s a Dart solution for that.
Flexible compiler technology lets you run Dart code in different ways, depending on your target platform and goals:
- Dart Native: For programs targeting devices (mobile, desktop, server, and more), Dart Native includes both a Dart VM with JIT (just-in-time) compilation and an AOT (ahead-of-time) compiler for producing machine code.
- Dart Web: For programs targeting the web, Dart Web includes both a development time compiler (
dartdevc) and a production time compiler (dart2js).
GOLANG PACKAGES:
- https://golang.org/pkg/
The Go programming language is an open source project to make programmers more productive.
Go is expressive, concise, clean, and efficient. Its concurrency mechanisms make it easy to write programs that get the most out of multicore and networked machines, while its novel type system enables flexible and modular program construction. Go compiles quickly to machine code yet has the convenience of garbage collection and the power of run-time reflection. It's a fast, statically typed, compiled language that feels like a dynamically typed, interpreted language.
COVID-19 is an emerging, rapidly evolving situation.
Get the latest public health information from CDC: https://www.coronavirus.gov .
Get the latest research from NIH: https://www.nih.gov/coronavirus.
Find NCBI SARS-CoV-2 literature, sequence, and clinical content: https://www.ncbi.nlm.nih.gov/sars-cov-2/.
https://opensource.com/article/20/4/python-data-covid-19
The Socrata Open Data API (SODA) provides programmatic access to this dataset including the ability to filter, query, and aggregate data.
API Endpoint
JSON
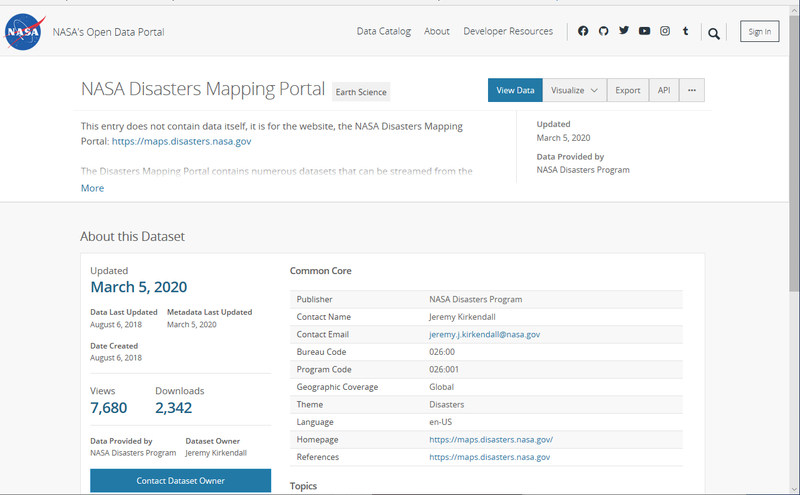
Nasa Disaster Mapping Portal
https://data.nasa.gov/Earth-Science/NASA-Disasters-Mapping-Portal/vyzu-gm3d
https://data.nasa.gov/browse?limitTo=datasets
https://zapier.com/learn/forms-surveys/simple-database-app-builders/
For instrument to build a simple app
https://open.esa.int/
https://api.nasa.gov/
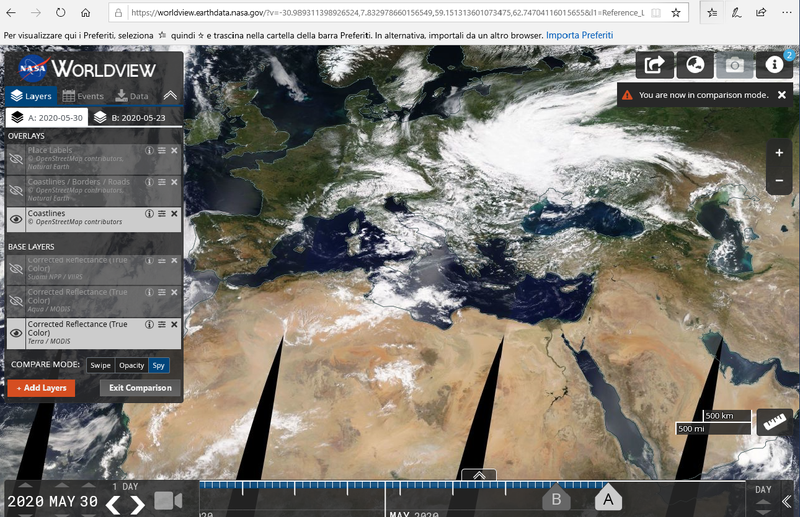
https://worldview.earthdata.nasa.gov/?v=-91.22684617271835,-30.460630826791003,109.22325809617271,91.65444829489692
https://nasa.github.io/data-nasa-gov-frontpage/
https://nasa.github.io/data-nasa-gov-frontpage/data_visualizations.html
Take care this !
https://www.opengis.ch/
https://qgis.org/en/site/
QGIS
A Free and Open Source Geographic Information System
https://52north.org/software/software-projects/ilwis/ilwis4/
Next Generation ILWIS – a modular application framework
Ilwis4 is a Windows-based, integrated GIS and Remote Sensing (RS) open source software. It contains a highly interactive desktop application based on drag-and-drop, map thumbnails and rich catalog functionality. The framework behind ILWIS 4 is called ILWIS-Objects, which supports the extension of functionality by means of Python scripts or by creating new -so called- connectors to new data formats, other programming languages or software libraries.
https://52north.org/software/software-projects/ilwis/
ILWIS – Remote Sensing and GIS
Integrated GIS and Remote Sensing (RS) open source software
ILWIS (The Integrated Land and Water Information System) is a remote sensing and GIS software which integrates image, vector and thematic data in one unique and powerful package. ILWIS delivers a wide range of features including import/export, digitizing, editing, analysis and display of data, as well as production of quality maps. ILWIS software is renowned for its functionality, user-friendliness and low cost, and has established a wide user community over the years of its development.
By Lawrence S. Meyers, Glenn C. Gamst, A. J. GuarinoPerforming Data Analysis Using IBM SPSS
Hello Team - i communicate some instruments for Statistical Analysis :
IBM SPSS Statistics - Overview | IBM
www.ibm.com › products › spss-statistics
Analyze and better understand your data, and solve complex business and research problems through a user-friendly interface. More quickly understand large ...
- is a very top program useful for every kind of data regression analysis i put it on my share space to the group
https://technology.jpl.nasa.gov/research#/earth-sciences
Dynamic monitoring of structures and infrastructure with terrestrial radar interferometry for disaster event recovery.
The goal is to use Synthetic Aperture Technology (SAR) to analyze Environmental Remote Sensing Data in our Dashboard and do related consideration to trends in Economy System in a Pandemic situation.
My ideas is to collect some datasets in energy consumption and availability for matching data and extract or elaborate them for further analysis related also with Covid-19 pandemia's and after do some analysis on with Economical considerations.
Map from the DPI dataset showing global development potential for wind power ranging from very low (light pink, left side of scale at bottom of image) to very high (dark purple on right side of scale at bottom of image). Click on image for larger view. Image: Oakleaf, J.R., Kennedy, C.M., Baruch-Mordo, S., Gerber, J.S., West, P.C., Johnson, J.A. & Kiesecker. J. (2020). “Global Development Potential Indices.” Palisades, NY: NASA SEDAC. https://doi.org/10.7927/k9t6-gh59.
https://earthdata.nasa.gov/learn/pathfinders/covid-19
https://cesium.com/cesium-ion/
https://onesaitplatform.atlassian.net/wiki/spaces/OP/pages/46104695/GIS+Creating+a+GIS+viewer+with+Cesium+representing+GeoJson+served+by+an+API+REST+from+the+API+Manager
This are ideas on platform for publishing data :
- https://cesium.com/docs/
- https://cesium.com/docs/tutorials/optimizing-quotas/
I'm only add some suggestions to the team nothing is definitive ...
https://www.freecodecamp.org/news/https-medium-freecodecamp-org-best-free-open-data-sources-anyone-can-use-a65b514b0f2d/
TAG
Energy, Clean Energy, Covid-19, Renewable, Energy infrastructures, Energy dashboard,
energy supply, energy for clinical diagnosis, Covid-19 Emencency Energy Consumption,
Network of Energy Producers, Network or Infrastructures of Energy Management Systems.
MY PERSONAL RESEARCH ON OPEN DATA
- https://lpdaac.usgs.gov/products/ast_l1bv003/#tools
- https://energy.duke.edu/research/energy-data/resources
- https://eerscmap.usgs.gov/uswtdb/data/
- https://www.ief.org/resources/data-visualisation.aspx
- https://www.lib.ncsu.edu/gis/datalist
- https://docs.google.com/spreadsheets/d/1NOhOdMSQNGi7tgTCZvlvdEFWKtk7NokdUuBD-lquO28/edit#gid=0
- https://landsat.gsfc.nasa.gov/data/where-to-get-data/
- https://global.jaxa.jp/area/energy/index.html
- and so on ….
Originally this is the main point focused point :
SDG 7, Access to Clean and Affordable Energy
Target
7.1, By 2030, ensure universal access to affordable, reliable, and modern energy services
Indicator
7.1.1, Proportion of population with access to electricity Target
7.3, By 2030, double the global rate of improvement in energy efficiency Indicator
7.3.1, Energy intensity measured in terms of primary energy and GDP
Example Resources
- GSFC Air Quality Website
- The Global Partnership for Sustainable Development Data COVID Resources
- The UN Sustainable Development Goals Knowledge Platform
- The SDG Indicators Metadata Repository — The latest reference metadata information provided by the UN System and other international organizations on data and statistics for indicators in the Global Indicator Framework
- Tools and Guides by UN Habitat for SDG 11 (Sustainable Cities and Communities) Indicators
- Access Euro Data Cube SentinelHub resources
- NASA Open Earth Exchange (OpenNEX)
- NASA Earthdata
- NASA GSFC GMAO and MERRA-2 web pages
- NASA ARSET Trainings for Monitoring & Meeting the UN Sustainable Development Goals
- LandsatLook Viewer
- Land Processes Distributed Active Archive (LP DAAC)
- Socioeconomic Data and Applications Center (sedac)
- NASA Worldview
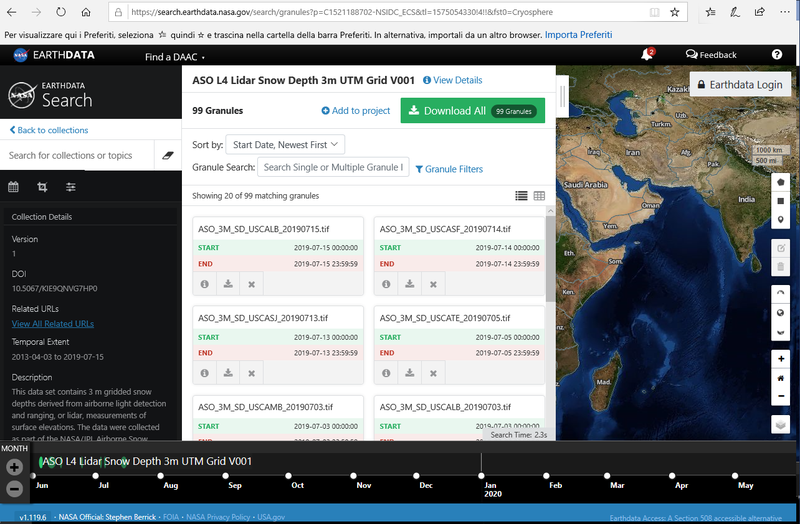
- Earthdata search
- Earthdata Common Metadata Repository
- NASA COVID-19 data pathfinders
- NASA SEDAC Global COVID-19 Viewer
- NASA OceanColor Web
- USGS Sentinel-2 Look Viewer
- ESA Copernicus Open Hub
- The Group on Earth Observations (GEO) Earth Observations for Sustainable Development Goals (EO4SDG) Initiative
- The CEOS 2030 Agenda for Sustainable Development and Sustainable Development Goals Handbook
- GEO: Earth Observations in support of the 2030 Agenda for Sustainable Development
- JAXA Satellites for SDGs 15 - Forest Monitoring-
- JAXA Satellites for SDGs 13 - GHG Monitoring-
- JAXA Satellites for SDGs 3 - Air Pollution Monitoring-
- JAXA Satellites for SDGs 2 - Agriculture Information-
- JAXA Satellites for SDGs 11 - Disaster Response-
- JAXA Satellites for SDGs 6 - Water Cycle Monitoring -
- JAXA Satellites for SDGs 11 - Infrastructure Monitoring -
Team-viewer
http://www.teamviewer.com/download
Search Results
Web result with site links
Blizz by TeamViewer - Global Team Collaboration | Video ...
![]()
www.blizz.com
INSTRUMENTS AND TECHNOLOGIES
I would follow a botton-up and top-down approach. Analytical-Algorithmic-Socio-Economic Approach. I am inspired by respect for the environment and the ecosystem.
I would use modern distributed, object, multi-agent, RAD development tools. Multilingual and multiplatform Tools. I have not yet decided which language to use but it could be Java,Jsp,ASP.NET,C++,C#, Python,Angular JS etc. I’m open to evaluate suggestions and Open Data Technologies... and so on
DESCRIBE HOW YOUR PROJECT ADDRESSES THIS CHALLENGE:
The challenge may consist in assembling, analyzing, investigating the relationship between datasets belonging also to different categories. It must allow to provide performance and quality indicators on the change related to many aspects always linked to population growth / descriptions, energy supply, soil consumption, air quality, use of water sources, human settlements. Allow third party sources to process data and be able to interpret them clearly.
Evaluate soil consumption in relation to energy availability; offer food for thought to monitor the change in reference to SDG 7 (energy access and resilience).
Making the information accessible and interpretable to various degrees of freedom by bodies, institutions, individuals, foundations, research institutes, mass media, the world of industry, culture and public education etc.
Monitor the services related to clean energy - Study the energy supply for the use of sources of clean energy. Over time monitor the energy infrastructure and energy supply.
What changes with the introduction of risk factors such as Covid-19.
Get information on the infrastructure and monitoring parameters.
Ensure an intelligent use of renewable and research energy sources, which are reliable, modern, safe, efficient, clean.
Study the interrelationships between population and energy consumption. Predict how the population will have access to energy sources and future needs.
Link the observations with the measurements on atmospheric precipitations, atmospheric electricity loads, industrialization and ruralization, population migration, mobility of the Networks.
Consider a Panorama or scenario between 2020-2030; 2020-2050.
How the energy distribution, efficiency and urbanization of the planet will change.
Link energy consumption to the Covid-19 event, monitor daily energy needs for hospital facilities and clinical diagnostic machinery.
Provide poverty / wealth indicator for access to low cost and good environmental impact renewable energy sources.
For anyone who wants to join me to work on SDGs & COVID-19, you are welcomed!
Together, we can make a brighter and cleaner future. Now, let's explore something between sustainable developments and COVID-19.