Team Updates
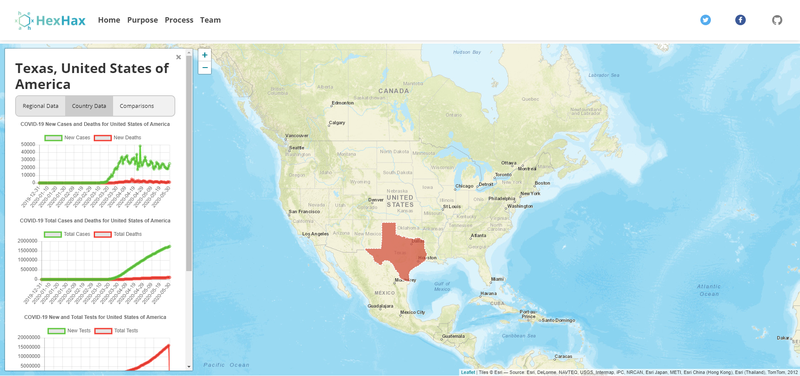
Here's a photo showcasing our finalized website!
C
Christina Wong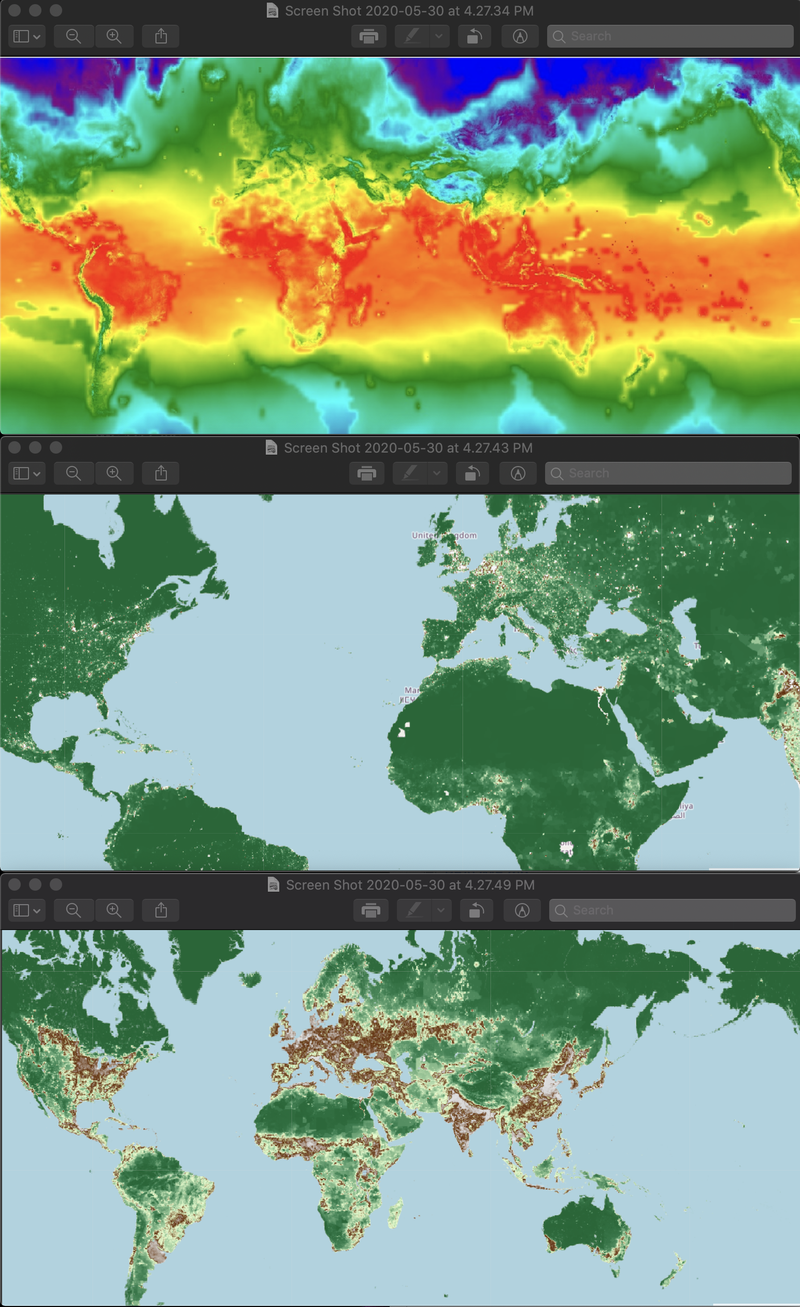
Our first few graphs have been successfully created! From top to bottom, these show global climate, population density, and global human modification, using two NASA datasets, and one from the Conservation Science Partners.
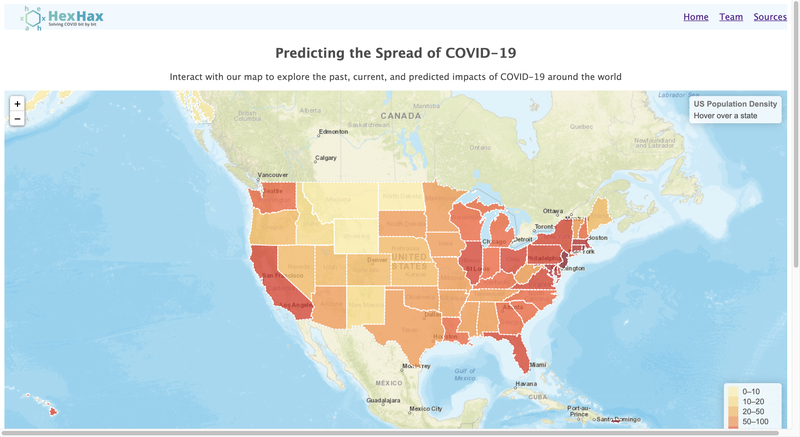
The first version of the map on our website is live! Currently, the map displays the population density for each US state, but will be updated with more data in the coming hours :)
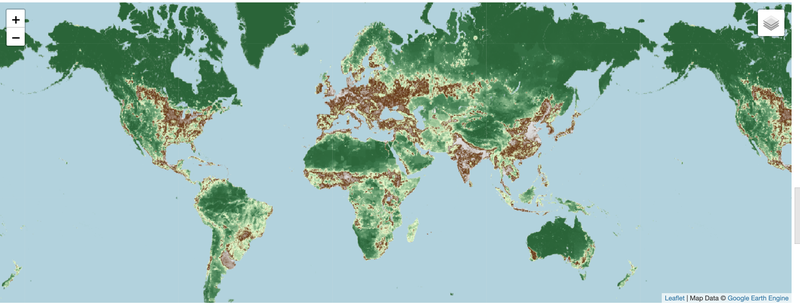
Our first map visualizations are going well! Here is a dataset visualization developed in Python using the Earth Engine API and the Folium library, using data from the Conservation Science Partners.

Excited to develop our project for the next two days!

Look at HexHax's first logo design!